“Self gating techniques are very helpful alternatives for robust cardiac imaging without compromising the accuracy of the derived myocardial function parameters.”
Functional cardiac mr imaging (CMR) requires high muscle/blood contrast, full coverage of the cardiac cycle and high temporal resolution. For this purpose ECG is commonly used for cardiac gating. ECG being an electrical measurement is disturbed by interference with the magnetic field, which is pronounced at ultra high fields. The self gating technique IntraGate is a very helpful alternative for robust cardiac imaging without compromising the accuracy of the derived myocardial function parameters.
While gross effects of myocardial infarction, such as those shown in Fig. 1, can easily be visually assessed in the short axis (SAX) and 4 chamber (4CV) views, this does not provide any quantitative information about the underlying pathology, which is essential in most studies. For quantitative evaluation 3 image series have been acquired: 2 single slice IntraGate™-FLASH cine series, one in 2 chamber and one in 4CV view and one multi-slice IntraGate™-FLASH cine SAX scan. For evaluation a 3rd party software is used.

Fig. 1B – D: SAX views of a healthy mouse heart (B) and hearts 4 weeks after a myocardial infarction (C, D), shown in diastole
An important issue in the evaluation is a careful segmentation of epi- and endocardial borders (Fig. 1A) which has to be done for all slices covering the left ventricle for cardiac phases derived from end systole and end diastole. The numerical results obtained include the end systolic volume (LVESV) in ml, the end diastolic volume (LVEDV) in ml, the left ventricular ejection fraction (LVEF) in percent, the stroke volume in ml, and the ventricular mass (LVM). Figures 1 B to 1 D show a comparison of SAX views derived from a healthy mouse heart (B) with images obtained from animal models of myocardial infarction (C, D). For this purpose occlusion of the left anterior descending LAD coronary artery was applied. Significant wall thinning can be observed for the segments in the posterior (C) and lateral (D) wall.

Significant differences occurred in the EF (C, reduced after infarction, p < 0.0001) and LVEDV (D, increased after infarction, p < 0.05)
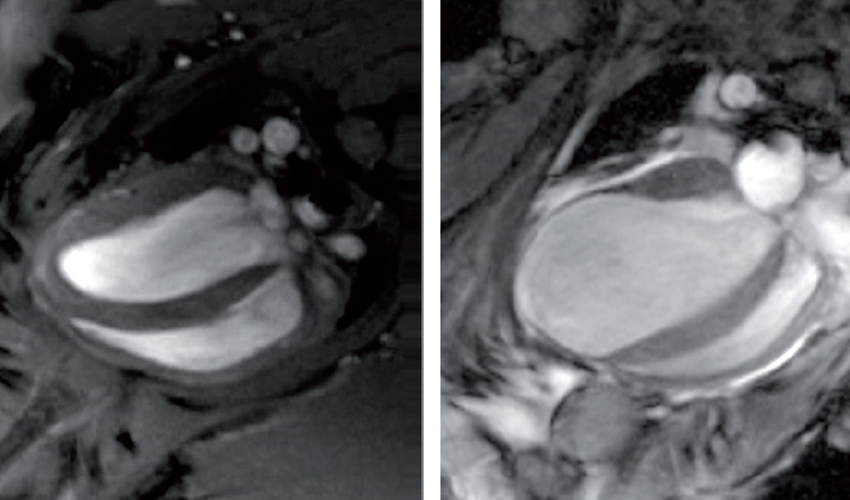
Figure 2 shows a four chamber view (4CV) of a healthy mouse heart (left) and a heart four weeks after a myocardial infarction (LAD occlusion) in diastole. The left ventricle is markedly enlarged and the apical segments of the myocardium are reduced to a very thin layer. In this case no extra blood suppression was applied.
Andreas Pohlmann1, Philipp Boyé2, Babette Wagenhaus1, Dominik Müller2, Mateusz, Kolanczyk3, Jeanette Schulz-Menger2 and Thoralf Niendorf1, 2
1) Berlin Ultrahigh Field Facility, Max Delbrück Center for Molecular Medicine (MDC), Berlin, Germany,
2) Experimental and Clinical Research Center, Charité University Medicine, Campus Berlin-Buch, Germany,
3) Research Group Development and Disease, Max Planck Institute for Molecular Genetics, Berlin, Germany

